Explored by:
Aubrey D. Johnson
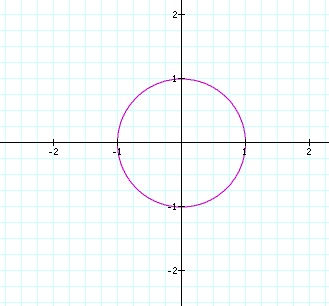
We will now explore quadratic equations. We will start with a basic parametric equation and graph. 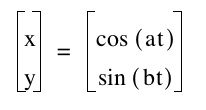 In this investigation we will see how altering a and b change the graph. First we must understand what the basic parametric graph looks like. (In this investigation "t" will always be between 0 and pi.)
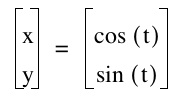
So what happens when we put the same number in for both a and b, lets say, 5?
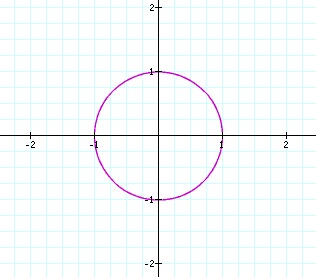
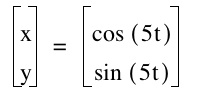
This is interesting. I really thought that adding a five before the variable t would make the graph larger, or smaller. Maybe it stayed the same size because we used a whole number. Let us keep a and b the same, again, but this time we will use the fraction (1/3) and see what that does to the overall equation.
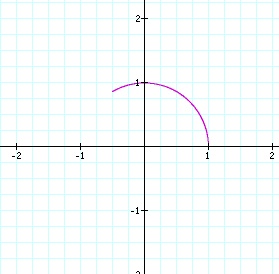
Now this is interesting. The fraction created an incomplete circle. It actually looks like (1/3) of the circle. Will we get more or less of the circle if we use a different fraction? Let us try with (1/2) for both a and b.
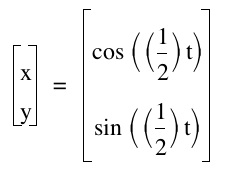
Well now we have half the circle. So using the same whole number for a and b does not alter the graph, but using the same fraction for a and b will give the fraction amount of the graph.
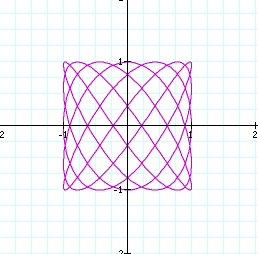
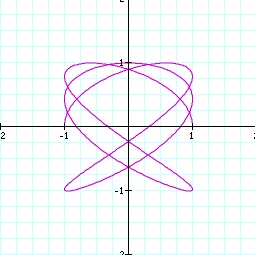
Now I would like to see what would happen if you use two different whole numbers fro a and b. We will use a = 5 and b = 7.
So what will happen if we change a=5 to a=3 and b=7 to b=12.
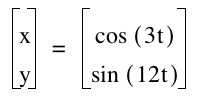
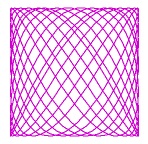
Notice how the curve is looser. What would happen if we switched the 3 from a to b, and the 12 from b to a?
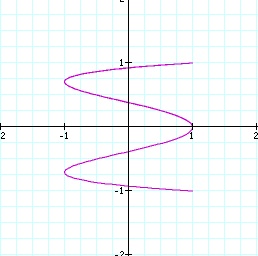
I was not expecting to see the graph flip on its side. Does the placement of the larger and smaller numbers determine how the graph will be displayed? Let us test this theory. We will see if the larger number on top makes a difference. let us change
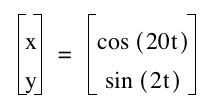
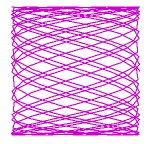
It would appear that the lager the difference between a and b (with a being larger then b) the lighter the vertical graph becomes. Let us see what happens when a=7 and b =5. These are taken from a previous graph.
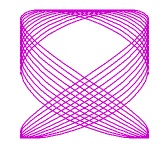
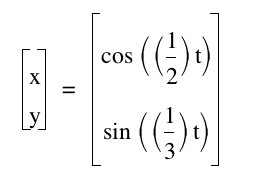
This is an interesting graph. It almost appears to be flipping from a horizontal graph to a vertical one. Let us see what happens when a=21 and b=19.
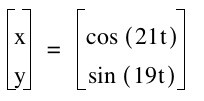
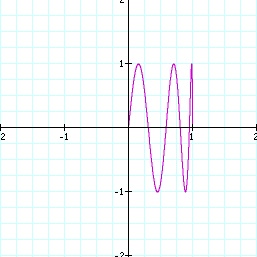
This is a very complicated graph. It is hard to tell what exactly is going on from previous examples it would appear that as a or b gets larger the graph tends to become more complicated. Let us see what fractions do to the graphs. We will start with a=(1/2) and b=(1/3).
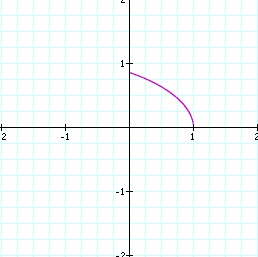
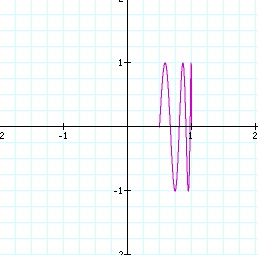
The two fractions made the graph smaller. Let us now mix fractions and whole numbers. a=(1/2) and b=5.
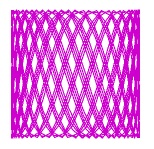
The fraction seems to determine how much of the graph will be displayed. This appears to only be 1/2 of the graph. Let us see what happens when we have a=(1/3) and b will remain the same.
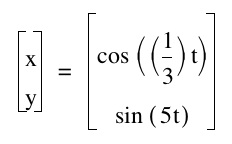
Now it appears to only be showing 1/3 of the graph. But notice the frequency has increased from (1/2) to (1/3). So the fraction increases the frequency and determines the amount of space that the graph will take up. We have seen that larger whole numbers make a complicated graph. If the difference between a and b are great, the graph becomes less complicated, then if a and b are close to but not equal to each other. When a=b we get a complete circle. Finally we saw that if a is larger than b, the graph will be aligned on the y-axis and appear vertical, except when a and b are number that are close to each other, like a=21 b=19 and a=7 b=5. We can make the graphs as complicated and as simple as we wish. Other versions of the graph are at the bottom to demonstrate the endless possibilities you have with these graphs. See if you can guess the equations knowing the ideas that we have investigated.